
Dashboard
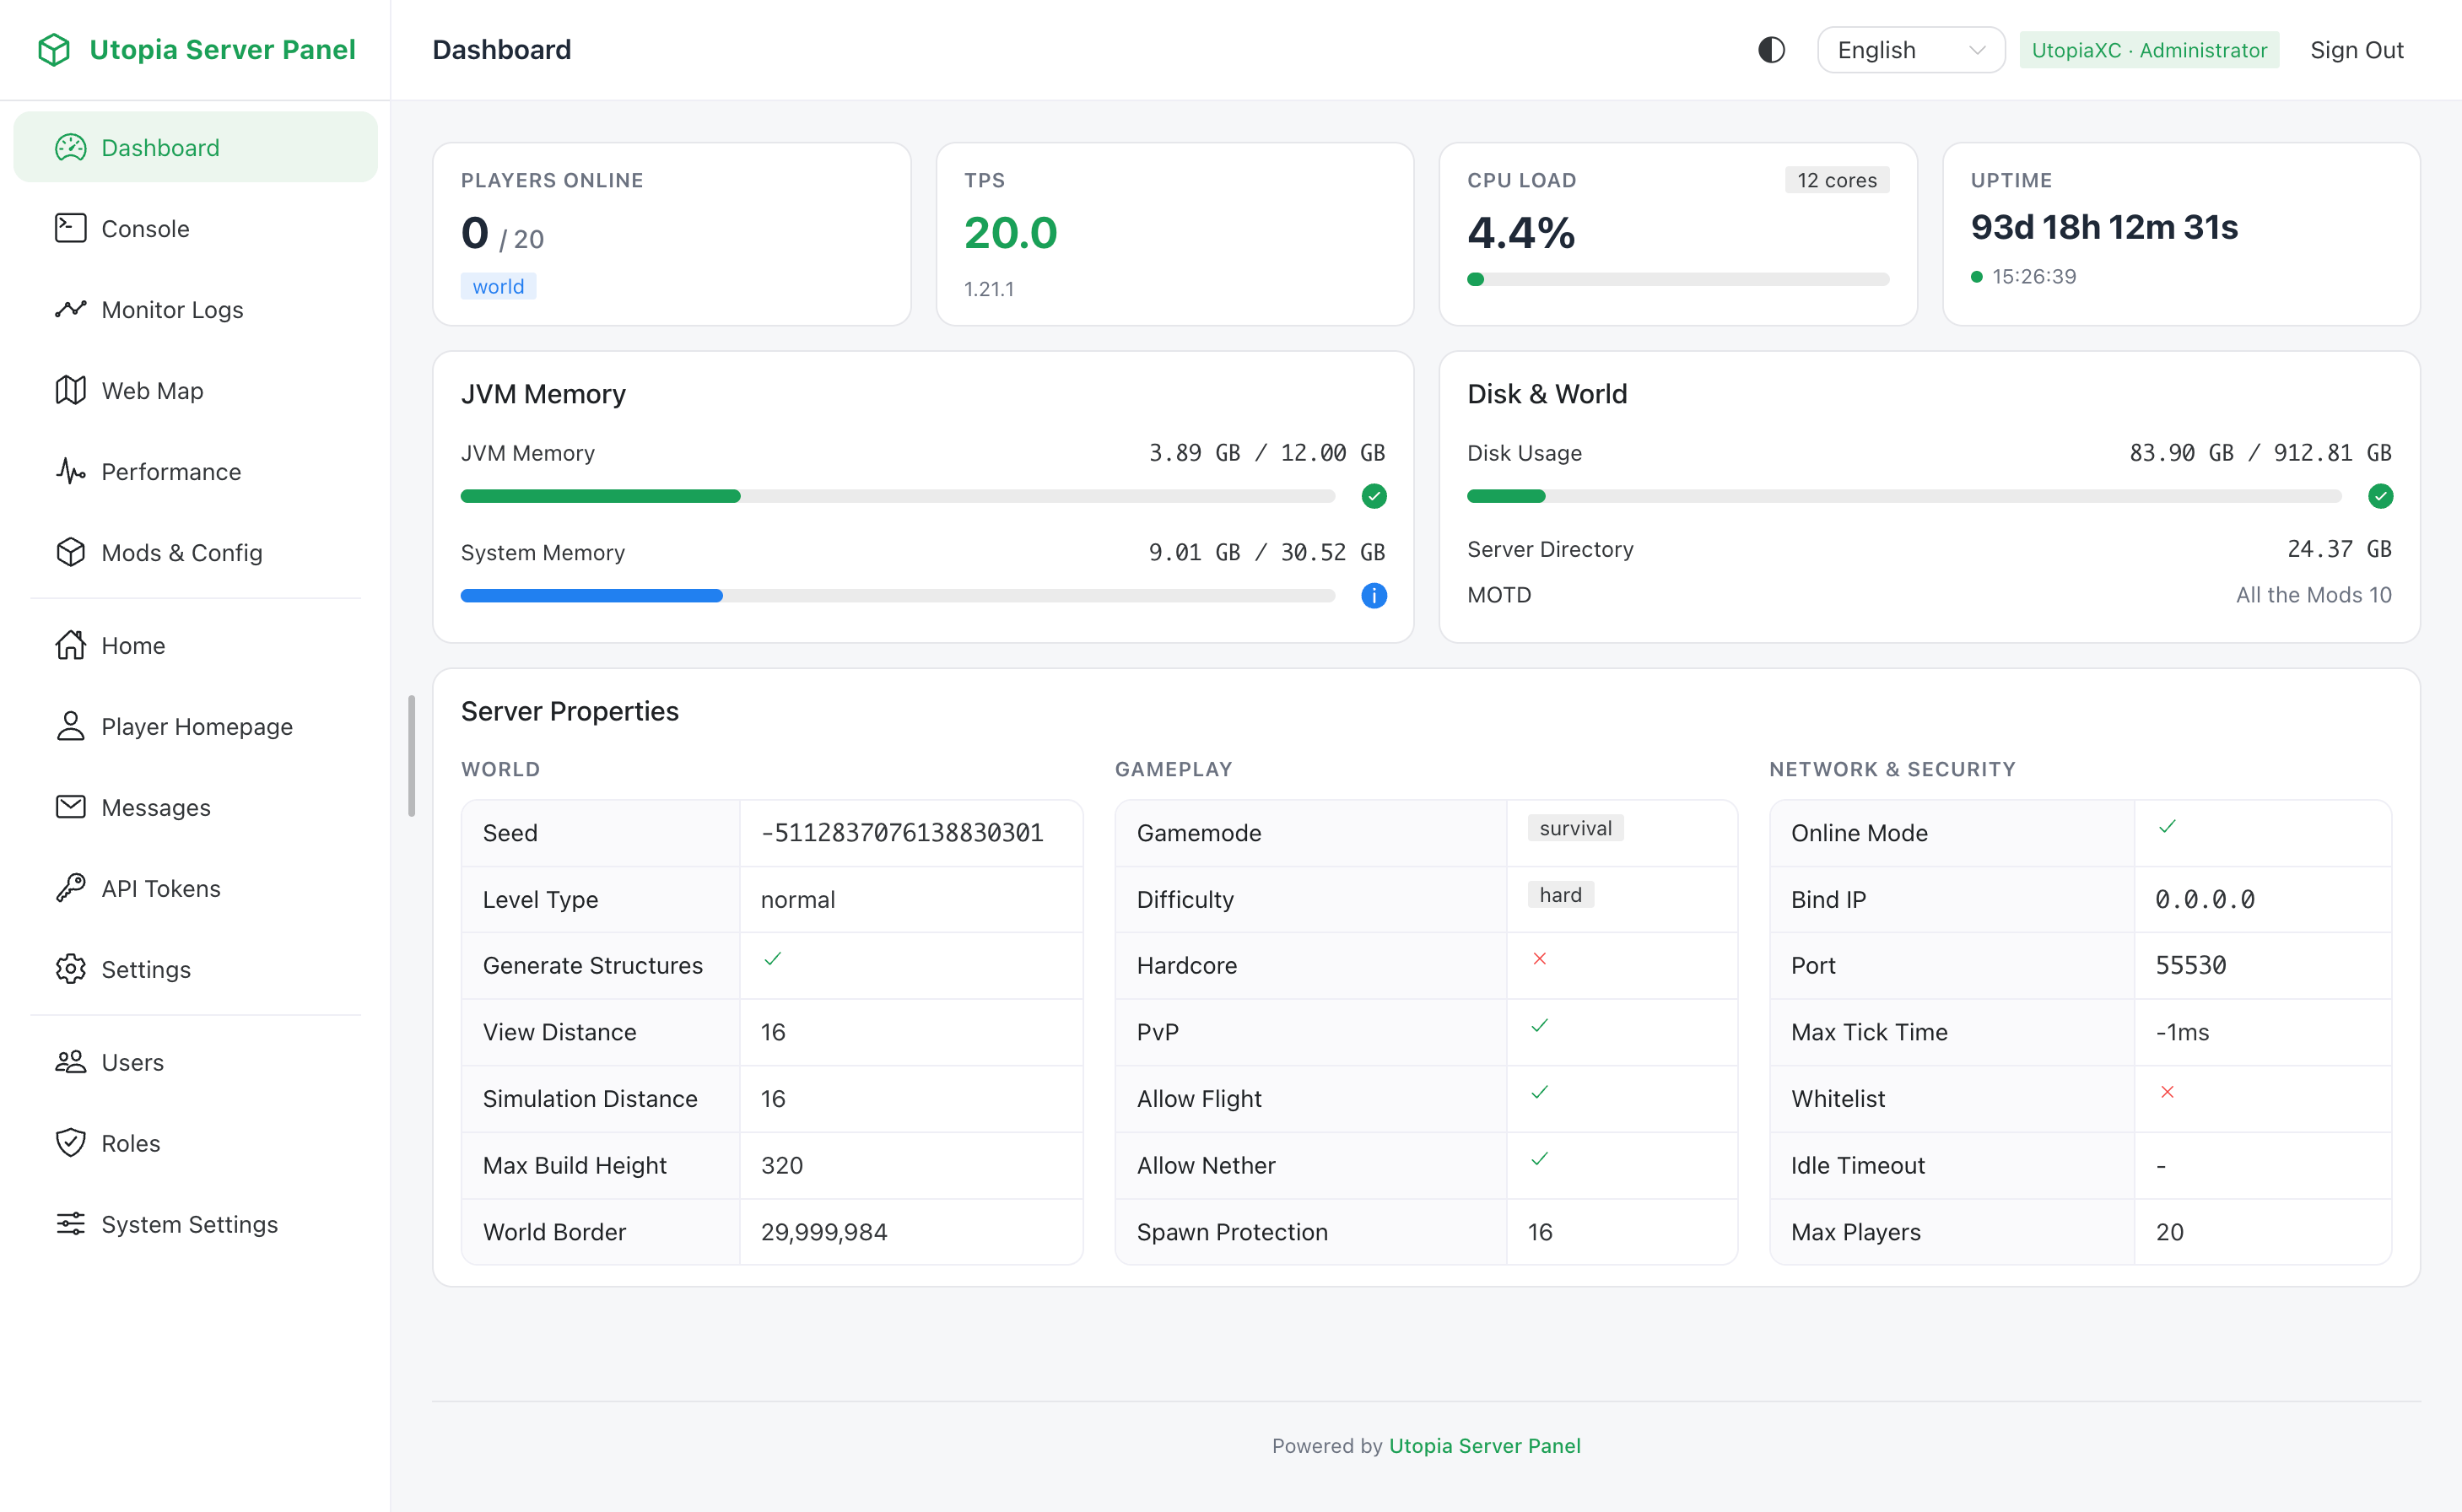
The Dashboard is the primary view of the panel and requires at least read-only dashboard:1 permission. It receives incremental status updates over WebSocket to display real-time server health and online player activity.
Displayed Metrics
The Dashboard includes the following live status cards:
- Server Overview: Displays running state, Minecraft version, mod loader and version, world name, MOTD, online player count versus capacity, and uptime.
- Game Performance: Streams live TPS and MSPT figures so you can spot main-thread lag immediately.
- Hardware & JVM Resources: Displays CPU usage, JVM heap and system memory consumption, disk usage, and system load.
- Online Players: Lists currently connected players with latency and links to their public player profiles when bound.
- Server Lifecycle Card: Shows the current run start time and recent start/stop history.
Related Settings
- Status broadcast frequency is controlled by
broadcastIntervalinconfig/utopia_server_panel.toml, defaulting to3000ms. - Historical monitoring charts and player name visibility are governed by
monitorEnabledandmonitorShowPlayerNamesunder System Settings -> Panel Features -> Monitoring. See Panel Settings. - To allow unauthenticated visitors to view server status on the landing page, ensure the
guestrole hasdashboardset to level1.